


Tide Calculations for Places Other Than Standard Ports
Secondary places are locations with similar tidal patterns to a standard port for which tide times and heights can be estimated by applying ratios and offsets to the tides at the adjacent standard port, provided some tidal analysis has been performed at the secondary place.
This page explains how to calculate the time and height of tides at a secondary location using data from a nearby standard port. To do this, find the required locality in the semidiurnal tidal planes table or the diurnal tidal planes table and note its standard port.
How to Calculate Tide Times and Heights
Time of high water
- Find the time difference for high water (column 1 in the tidal plane table).
- Add or subtract (as indicated by + or -) this time difference to the predicted time of high water at the standard port.
- The result is the approximate time of high water at the secondary location.
Time of low water
- Find the time difference for low water (column 2 in the tidal plane table).
- Add or subtract (as indicated by + or -) this time difference to the predicted time of low water at the standard port.
- The result is the approximate time of low water at the secondary location.
Height of high water
- Find the height of the predicted high water at the standard port.
- Multiply the height by the ratio in column 8.
- Add or subtract (as indicated by the + or -) the constant in column 9.
- The result is the approximate height of high water at the secondary location.
Height of low water
- Find the height of the predicted low water at the standard port.
- Multiply the height by the ratio in column 8.
- Add or subtract (as indicated by the + or -) the constant in column 9./li>
- The result is the approximate height of low water at the secondary location.
Example Tide Data
Example Extract from the Semidiurnal Tidal Planes Table
Height above Queensland Port Datum (LAT(12992))
| Place | Latitude | Longitude | Time difference | MHWS | MHWN | MLWN | MLWS | MSL | Ratio | Cons | HAT | |
|---|---|---|---|---|---|---|---|---|---|---|---|---|
| South | East | HW | LW | |||||||||
| 1 | 2 | 3 | 4 | 5 | 6 | 7 | 8 | 9 | 10 | |||
| HM | HM | m | m | m | m | m | m | m | m | |||
| Standard | 27 05 | 152 07 | Standard | Port | 2.22 | 1.84 | 0.81 | 0.42 | 1.32 | 1.00 | 0.00 | 2.78 |
| Secondary | 27 05 | 153 22 | -0 25 | -0 30 | 1.80 | 1.49 | 0.65 | 0.34 | 1.07 | 0.81 | 0.00 | 2.26 |
Example Tidal Predictions at Standard Port
Date: 16 March 2022
| Time | Tide Height (m) |
|---|---|
| 02:09 | 0.56 |
| 08:29 | 2.39 |
| 15:04 | 0.60 |
| 20:44 | 2.00 |
Secondary Location Adjustment Values
| Time | Metres |
|---|---|
| Time difference high water (Column 1) | -0 25 |
| Time difference low water (Column 2) | -0 30 |
| Ratio (Column 8) | 0.81 |
| Constant (Column 9) | +0.00 |
Example Calculations of High and Low Water
High Water Calculation at a Secondary Location
Step 1: Standard Port Prediction
- Time of High Water: 08:29
- Height of High Water: 2.39m
Step 2: Apply Time Difference
- 08:29 – 00:25 = 08:04
Step 3: Calculate Height
- (2.39 × 0.81) + 0.00 = 1.94m
Result:
The first high water at the secondary location on 16 March 2022 is predicted to occur at 08:04 and reach a height of 1.94m above Queensland Port Datum (LAT(1992)).
Low Water Calculation at a Secondary Location
Step 1: Standard Port Prediction
- Time of Low Water: 02:09
- Height of Low Water: 0.56m
Step 2: Apply Time Difference
- 02:09 – 00:30 = 01:39
Step 3: Calculate Height
- (0.56 × 0.81) + 0.00 = 0.45m
Result:
The first low water at the secondary location on 16 March 2022 is predicted to occur at 01:39 and reach a height of 0.45m above Queensland Port Datum (LAT(1992)).
Example Calculation of Tide Height Between High and Low water
Find the height of high and low tide at the Standard port and secondary location at 6:40am on March 16 2022.
Standard Port Calculation
Step 1: Obtain the tidal predications from the tables at the Standard Port.
| Measurement | Time | Tide Height (m) |
|---|---|---|
| Low water | 02:09 | 0.56 |
| High water | 08:29 | 2.39 |
Step 2: Calculate the range of the tide.
- 2.39m – 0.56m = 1.83m
Step 3: Refer to the appropriate Standard Tidal Curves (or interpolated graph) for the tidal range.
If the required time is 06:40 (1 hour and 49 minutes before high water), we will use the range from step 2 to calculate the movement of a tide over a complete tidal cycle.
Using the 1.83m range to 1 hour 49 minutes before high water, you read the height at this point as 1.6m.
Standard tidal curves—tidal ranges up to 3m
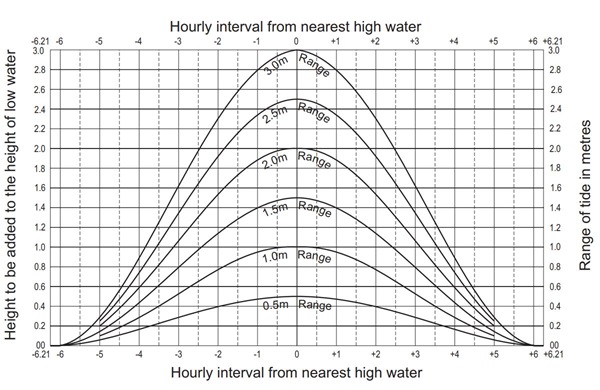
Step 4: Add the height obtained in step 3 to the height of low water at the standard port.
- 0.56m + 1.60m = 2.16m
Result:
At 06:40 on 16 March 2022 the tide at the standard port was approximately 2.16m.
Secondary Location Calculation
Step 1: Determine the high and low water times and the heights for the secondary location. In this example, tide heights and times have been determined in Example Calculations of High and Low Water.
| Measurement | Time | Tide Height (m) |
|---|---|---|
| Low Water | 01:39 | 0.45 |
| High Water | 08:04 | 1.94 |
Step 2: Calculate the range of the tide.
- 1.94m – 0.45m = 1.49m
Step 3: Refer to the appropriate Standard Tidal Curves (or interpolated graph) for the tidal range.
If the required time is 06:40 (1 hour and 24 minutes before high water), we will use the range from step 2 to calculate the movement of the tide over a complete tidal cycle.
Using the 1.49m range to 1 hour 24 minutes before high water, you read the height at this point as 1.3m.
Standard tidal curves — tidal ranges up to 3m
Step 4: Add the height obtained in step 3 to the height of low water at the secondary location.
- 0.45m + 1.30m = 1.75m
Result:
At 06:40 on 16 March 2022 the tide at the secondary location was approximately 1.75m.
Further information
Email [email protected] or call (07) 3066 3517 for information on Queensland tides.