Sea level measurement in Queensland
Why measure sea level?
There are several reasons why we need to measure sea level:
-
Tide predictions
There must be a long term and accurate set of tidal observations to generate accurate and reliable tidal predictions. To maintain this accuracy, there must be a continuing record of sea levels. -
Vessel traffic management
Tidal predictions are used in vessel traffic management centres for calculating vessel under keel clearance for planned vessel movements. Actual tidal observations are also used for under keel clearance calculations and for planning vessel movements. -
Port surveys
Sea level is measured as an aid to port depth surveys. -
Tidal planes
Tidal planes are calculated from long term sea level measurements and used for coastal development and emergency response in coastal regions. -
Monitoring sea level
Sea level is measured to assist with storm surge monitoring and in sea level rise studies.
The history of sea level measurement in Queensland
Sea level has been measured at Queensland ports since around 1890. The use of waterways for industry and recreation has always been an important part of the Queensland lifestyle. From the early days of settlement, people realised that to gain the most benefit from our waterways, it was important to know the pattern of the tides. There was sometimes insufficient depth of water to permit the ships to enter the ports along the Queensland coastline. It was from this humble beginning that tidal heights have been noted and recorded.
The first significant work in tidal prediction was undertaken towards the latter part of the nineteenth century. The Engineer-in-Chief of the Harbours and Rivers Department from 1875 to 1889, William Nisbet, established permanent tide gauges in the Brisbane River for river works and dredging projects.
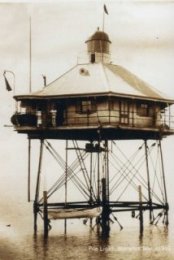
 By 1878, 6 gauges were installed between Brisbane and Lytton. These were primitive devices; a pile driven into the ground and marked at the level of the high water line of spring tides. From the recording of tides against these markings, the Postmaster's report of 1878 contained information about the mean tide level at the Brisbane Bar for each month between September 1877 and 1878. It was in 1890 that work undertaken by Edward Cullen, a marine surveyor, was successful enough to produce an accurate tide table. In March 1891, tables were issued containing the predicted heights and times of high water for the remainder of that year.
With the success of the tidal recording program at Brisbane, special instructions were issued to the Department of Ports and Harbours in January 1892 for all offices located along the coastline to observe and record the tides in a similar manner to that being done in Brisbane. With the records being uniform in their observation and noting, it provided a reliable data bank of information. When these were systematically analysed, they were made available to the public.
No further advance in technology occurred worldwide until 1976. This coincided with access to computer facilities and graphics digitising systems that greatly boosted the capacity to convert the state’s tidal records from analogue to digital form. Additionally, it meant that the records were stored digitally and were able to be retrieved rapidly and accurately processed. During 1980, tide observation altered dramatically. The Tidata, a precise digital tide recording and telemetry system, was designed and constructed by the Department of Harbours and Marine staff based in Brisbane. The first installation was on a beacon near Bishop Island, from which readings were transmitted to the Lytton Hill signal station for display, transmission to users, and recording.
Sea level measurement in Queensland today
In more recent times, Maritime Safety Queensland, Queensland port authorities, the Department of Environment and Science and the Australian Maritime Safety Authority jointly operate the tide gauge network around the Queensland coast. The network records the movement of the tide and storm surge events. Additionally, there are 2 tide gauges operated by the Bureau of Meteorology with the specific goal of monitoring sea level rise.
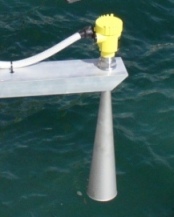
 The main type of tide gauge now in operation within Queensland ports is a radar based gauge. These have replaced the float and stilling well model that was more mechanical in design and subject to operational problems. Much of the historical sea level data for Queensland was collected with the float and stilling well tide gauge that incorporated a stylographic marker to create a line that recorded the tide height on a pre-printed analogue paper chart.
Operational permanent tide gauges in Queensland.
The most cost effective and reliable tide gauge for shipping purposes, by far, is the radar sensor. This sensor has many benefits over other technologies due primarily to their ease of operation and maintenance because the active part of the gauge is located above the water surface and measures the distance from this point to the air-sea interface. The Department of Environment and Science also use radar sensors for storm tide monitoring. However, in this instance, the radar is guided along a cable that extends down to the water surface with all components contained within a stilling well.
There are emerging technologies that are starting to be used in tide gauge applications in Queensland. The latest application proving to be versatile for port operations is based on laser technology. The laser ranging gauge operates at a very high frequency and with the added capability of measuring wave parameters, a component of information that is vitally important for under keel clearance determinations.
Port tide gauge array: Maritime Safety Queensland
 Maritime Safety Queensland’s operational requirement is to provide tide predictions to improve the quality and safety of commercial and recreational vessel movements. Shipping movements into and out of ports through the dredged channels, swing basin and berths demands knowledge of the precise amount of clearance between the seabed and a vessel’s hull at any time throughout its passage.
Tidal measurements are used for under keel clearance calculations in two ways. Firstly, in a real-time sense as actual sea level values for direct input into under keel clearance systems. Secondly, these measurements form the basis for the calculation of tidal predictions used in under keel clearance systems.
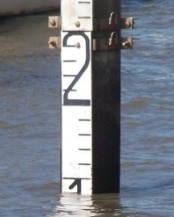
Under keel clearance systems provide shipping companies the knowledge to load their vessel to a maximum draught and still meet the under keel clearance requirements for safe operation in that particular port. A high level of accuracy is needed in measuring water level for this purpose. To ensure the accuracy of a port tide gauge, the water level measured on a tide board is compared to the tide gauge readings. Each tide board is in turn checked for vertical movement relative to land based benchmarks.
Storm tide array: Department of Environment and Science
A storm surge is an atmospherically forced ocean response caused by extreme surface winds and low surface pressures associated with severe and/or persistent offshore weather systems. A storm tide is the effect on coastal water levels of a storm surge combining with the normally occurring astronomical tide. Queensland coastal communities, property and infrastructure may be at risk from inundation caused by such events, and ready access to storm tide information is essential in providing timely and accurate advice about affected areas and potential inundation levels.
The Coastal Impacts Unit of the Department of Environment and Science maintain a network of 24 storm surge tide gauges along Queensland’s coastline. Their primary purpose is to record the magnitude of these storm tide events. However, as these events are quite rare, most of the time these gauges act as normal tide gauges recording the regular rise and fall of the tides.
The sea level information provided by the storm surge gauges are used to create storm tide maps that show the extent of coastal land vulnerable to tidal inundation, and the data and maps are used when considering the evacuation of communities during cyclone events, and for land-based planning purposes.
Storm tide monitoring: Department of Environment and Science
Sea level monitoring array: National Operations Centre (NOC) Tidal Unit
The National Operations Centre (NOC) Tidal Unit is responsible for maintaining the Australian Baseline Sea Level Monitoring Project (ABSLMP) sea level monitoring network and data analysis activities. The ABSLMP is designed to monitor sea level around the coastline of Australia aimed at identifying long period sea level changes. Long term sea level trends and their projected acceleration are a focus of the Intergovernmental Panel on Climate Change as a primary indicator of climate variation and change.
The project involves maintenance of an array of SEAFRAME (SEA-level Fine Resolution Acoustic Measuring Equipment) stations, which measure sea level very accurately, as well as meteorological parameters including atmospheric pressure, air and water temperatures, and wind speed and direction. The observations collected by ABSLMP stations will continue to be used for research into sea level and climate change, while real-time data streams allow for the monitoring of tsunamis and storm surges. While the record from the ABSLMP stations remains relatively short, the sea level records for all stations are beginning to demonstrate coherent sea level rises. These trends are in line with global trends estimated from satellite-based altimeters.
Sea level monitoring: National Operations Centre (NOC) Tidal Unit
Torres Strait array: Australian Maritime Safety Authority
The Australian Maritime Safety Authority maintains a network of 5 gauges in the Torres Strait area for use in shipping purposes. These gauges broadcast tidal data to ship captains in real-time, using VHF radio. Accurate real-time data is essential for ensuring safe passage of ships through the Torres Strait region.

